How to Measure Foot Traffic Accurately: The Data Core of Store Performance
You can't fix what you can't see. Right now, 73% of store-level decisions rely on intuition rather than data. That's a problem when profits depend on throughput, labor efficiency, and conversion rates across dozens—or hundreds—of locations.
Knowing how to measure foot traffic accurately means building a reliable data layer connecting customer demand to staffing, layout decisions, and P&L outcomes. Retail foot traffic dropped 17% overall, but that figure masks substantial variance between segments and individual stores. Indoor malls recorded a 1.8% year-over-year increase during the first half of 2025. The retailers pulling ahead measure accurately enough to spot these differences and act on them.
Four Core Technologies for How to Measure Foot Traffic Accurately
The sensor you choose determines every decision that follows. Here's what's available and where each technology fits.
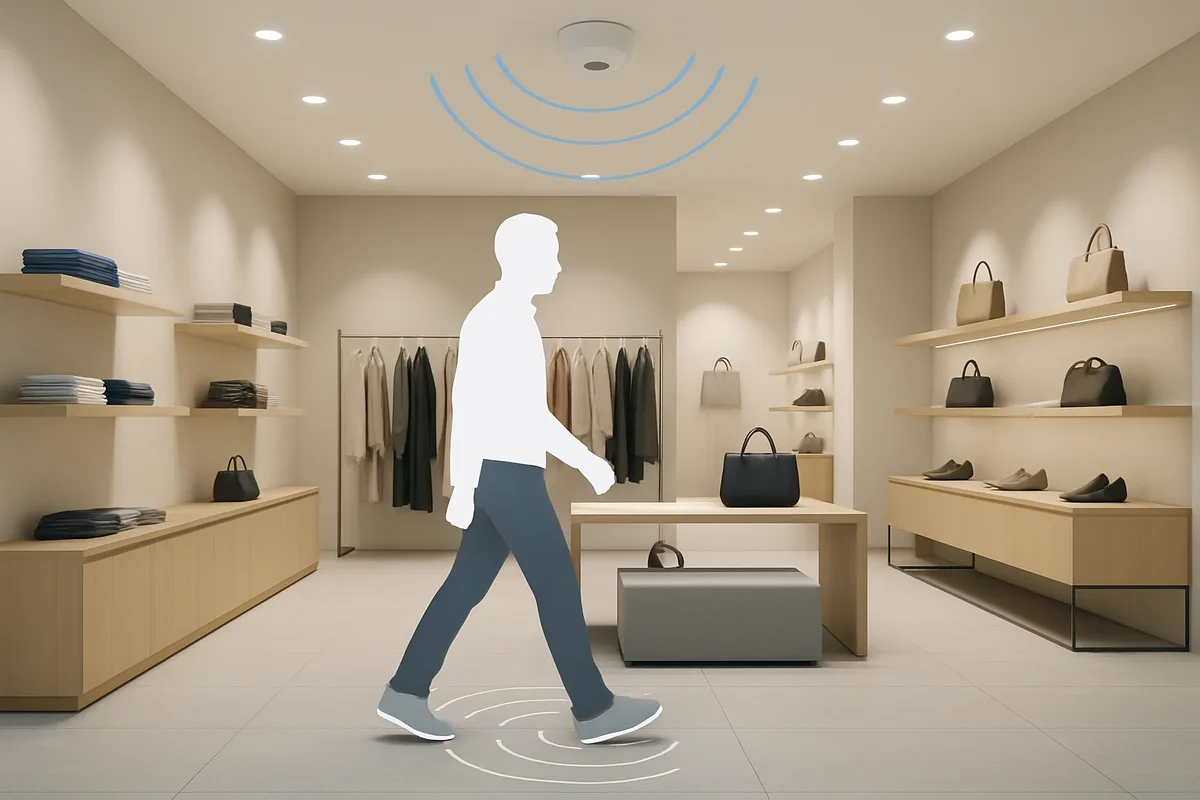
Radar sensors (mmWave)
Currently the gold standard for precision. Millimeter-wave radar works regardless of lighting conditions, shadows, or reflections. That matters in grocery, DIY, and big-box formats where conditions vary by zone—think sunlit entrance versus dimly lit warehouse section. Radar won't miscount when weather changes or overhead lighting flickers.
AI-powered video analytics
Cameras paired with machine learning capture more than simple headcounts. They track movement patterns, dwell behavior, and zone-level engagement. The trade-off? Video systems need careful configuration to maintain accuracy in crowded environments. Plus they raise more privacy questions than other options.
Thermal sensors
Thermal counting detects body heat signatures. No images, no video, no personally identifiable data collected—ever. For retailers operating under strict GDPR requirements across multiple European markets, thermal sensors offer anonymous counting with privacy compliance built into the hardware.
Choosing based on integration
Accuracy at the sensor level is only half the equation. Can the technology feed data directly into your POS system, workforce management platform, and reporting dashboards? A sensor that counts perfectly but lives in a standalone silo won't change how store managers schedule shifts or rearrange displays. Integration capability should be a top-three criterion in any evaluation.
Why Conversion Rate Calculations Fail Without Accurate Traffic Measurement
Conversion rate is the single most important metric in physical retail. Transactions divided by visitors. But if your visitor count is off by even 15%, every performance comparison you make—between stores, between weeks, between campaigns—is unreliable.
Sales reports tell you what happened. Not what could have happened. A store doing €40,000 on Saturday looks fine in isolation. But if 8,000 people walked through and only 1,200 bought something, that's 15% conversion—a massive missed opportunity. Without accurate foot traffic measurement, you'd never see the gap.
Consider two stores posting identical revenue numbers. Store A converts 22% of 5,000 weekly visitors. Store B converts 11% of 10,000. Same sales, completely different operational stories. Store B has twice the demand and half the conversion. Maybe it's understaffed during peak hours. Maybe the layout creates bottlenecks. You won't know unless you're counting accurately—and consistently—at both locations.
Essential Metrics Beyond Basic Visitor Counts
Raw headcounts are a starting point, not a strategy. The real value of knowing how to measure foot traffic accurately shows up when you layer behavioral data on top of volume data.
Dwell time analysis
How long do shoppers spend in your electronics aisle versus your seasonal display? Dwell time exposes engagement and friction. A high-traffic zone with low dwell time often signals poor product placement, confusing signage, or congested pathways that push people through instead of inviting them to browse.
Movement path tracking
Understanding how customers flow through zones—from entrance to checkout, from produce to bakery—exposes which areas actually drive behavior. If 60% of customers never reach your highest-margin department, that's a layout problem with direct revenue consequences.
Bounce rate for short visits
Visitors who enter and leave within 60 seconds are telling you something. Maybe the queue looked too long. Maybe the store felt understaffed. Tracking short-visit bounce rates highlights operational problems that transaction data alone would never detect.
Hot zones versus cold zones
Heat mapping identifies where customers concentrate and which areas they ignore. Moving high-margin products into hot zones, improving signage in cold zones, adjusting aisle flow based on actual behavior—these are changes you can measure and iterate on rather than guessing.
Staffing Optimization Through Real-Time Traffic Intelligence
Labor is your biggest controllable cost. Staffing decisions made without traffic data are educated guesses at best.
Most scheduling still runs on sales patterns—last Tuesday's revenue predicts this Tuesday's staffing. But sales data misses a critical variable: how many customers actually showed up? A slow sales day doesn't always mean low traffic. Sometimes it means high traffic with too few associates on the floor, leading to long queues and abandoned baskets.
Real-time foot traffic data lets you match labor to demand as it happens. When an unexpected surge hits at 2 PM on Wednesday—driven by weather, a local event, or a competitor's closure—store managers can react before service quality degrades. That's the difference between a customer who waits three minutes and buys versus one who walks out.
Eliminating overstaffing during predictably quiet periods reduces labor waste without cutting coverage below acceptable levels. One European grocery chain reduced weekly labor hours by 12% across 80 stores while maintaining customer satisfaction scores—simply by aligning schedules to traffic patterns rather than sales history.
Implementation Strategy: From Data Collection to Operational Impact
Privacy-compliant deployment
Any system collecting in-store data must meet GDPR requirements from day one. Anonymized, aggregated data collection—where no images, videos, or personal information are stored—isn't optional. It's the starting point. Your legal and compliance teams should sign off on the data architecture before a single sensor goes up.
Integration with existing systems
Foot traffic data becomes powerful when it connects to what you already have. POS integration lets you calculate real conversion rates automatically. Workforce management connections enable demand-based scheduling. Weather data feeds add predictive value—rain on Saturday in a suburban shopping park has quantifiable impact on traffic patterns.
Pilot before you scale
Don't roll out across 200 stores on faith. Pick 3–5 locations representing your format diversity: a flagship, a mid-performer, and a struggling location. Run parallel counts—manual audits alongside automated sensors—for at least four weeks. Compare accuracy rates. Validate that data matches what store managers observe on the ground. Only then expand.
AI-powered systems now support predictive demand forecasting and automated anomaly detection. But those capabilities are only useful if the underlying count data is trustworthy. Get the foundation right first.
Measuring Results: KPIs That Prove Foot Traffic Analytics ROI
Three metrics tell you whether your investment in accurate traffic measurement is paying off.
- Conversion rate improvement. After optimizing layouts and staffing based on traffic data, track conversion rates store by store. Even a 1-percentage-point lift across a 150-store chain translates to significant revenue gains without a single additional marketing dollar.
- Labor cost reduction. Compare total labor hours per visitor before and after implementing traffic-based scheduling. The goal isn't fewer staff—it's the right staff at the right times. Measure cost per visitor served alongside customer satisfaction to ensure quality holds.
- Revenue per visitor. This metric captures the combined effect of better layouts, better staffing, and better flow management. When customers find what they need faster, wait less, and encounter well-stocked shelves in the right zones, they spend more per visit.
Track these monthly at the store level. Quarterly at regional level. Annually for strategic planning and capital allocation decisions. The retailers treating foot traffic as a core KPI—not a secondary metric—are making smarter decisions at every level of the organization.
Sources
- Placer.ai Mall Index — indoor malls recorded 1.8% year-over-year foot traffic increase in H1 2025
- Chain Store Age — Placer.ai Mall Traffic Report — half-year traffic analysis across mall formats
- IBM-NRF Consumer Study 2026 — 72% of consumers still shop in stores despite AI-driven buying journeys
- Retail Dive — Foot Traffic and Post-Pandemic Retail — measurement methodology and conversion rate analysis
- Placer.ai October 2025 Mall Index — shoppers returning to malls, ongoing traffic recovery trends